| |
| Capital |
Currency | Government system |
|---|
| Brussels |
Euro (EUR) |
Constitutional hereditary monarchy |
| Official language | Region |
Population |
|---|
Dutch
French
German |
Europe |
Estimation 2024 - 11 763 650 |
Country map - Administrative structure - Population density of Belgium
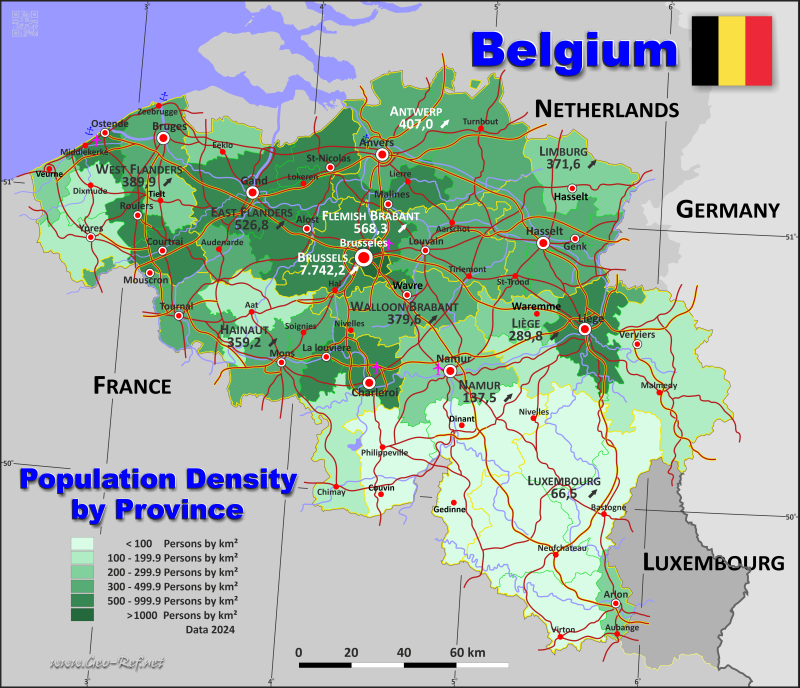
Belgium - Click on the map to get a enlarged image in PDF format!
Other language versions are easy to generate, the description is in an own layer
Conditions for thematic maps with your own data and logotype
Delivery as printable file by e-mail or plot by post office |
|---|
| Layer | |
| Province: | yes |
| Streets: | yes |
| Infrastructure: | yes |
| Rivers: | yes |
|
| Size | bis A2 |
| Supply in | 7 working days |
| Price |
| 1 bis 3 | 75 € |
| > 3 | On request |
|
 |
All information published herein is free usable quoting the source,
including the maps, if they are not modified |
|---|
Statistical Data - Population density according to the administrative structure
The population data in the table below is an estimation for 2024, based on the census data from 2012.
Click on the column header brings the table in order of the column header. The default order is the Province name.
| Province |
ISO
3166-2 |
Capital |
Area
(km²) |
Population |
Density
(pers/km²) |
|---|
| Total |
|
|
30 547 |
11 763 650 |
385,1 |
|---|
| Last update: 09/06/2025 - 03:01:55 |
| Antwerp |
BE-VAN |
Antwerpen |
2 849 |
1 926 522 |
676,2 |
| Brussels |
- |
- |
162 |
1 249 597 |
7 713,6 |
| East Flanders |
BE-VOV |
Gent |
3 000 |
1 572 002 |
524,0 |
| Flemish Brabant |
BE-VBR |
Leuven |
2 118 |
1 196 773 |
565,0 |
| Hainaut |
BE-WHT |
Mons |
3 786 |
1 360 074 |
359,2 |
| Liège |
BE-WLG |
Liège |
3 862 |
1 119 038 |
289,8 |
| Limburg |
BE-VLI |
Hasselt |
2 422 |
900 098 |
371,6 |
| Luxembourg |
BE-WLX |
Arlon |
4 440 |
295 146 |
66,5 |
| Namur |
BE-WNA |
Namur |
3 666 |
503 895 |
137,5 |
| Walloon Brabant |
BE-WBR |
Wavre |
1 097 |
414 130 |
377,5 |
| West Flanders |
BE-VWV |
Brugge |
3 145 |
1 226 375 |
389,9 |
The provinces of Belgium are divided into arrondissements, which are shown in the following table in their assignment to the provinces. Since there are no ISO 3166 data for the arrondissements, instead the HASC codes are given .
| Arrondissement |
HASC |
Province |
Capital |
Area
(km²) |
Population |
Density
(pers/km²) |
|---|
| Total |
|
|
|
30 547 |
11 763 650 |
385,1 |
|---|
| Last update: 09/06/2025 - 03:01:55 |
| Aalst |
OV AL |
East Flanders |
Aalst |
469 |
304 838 |
650,0 |
| Antwerpen |
AN AW |
Antwerpen |
Antwerpen |
982 |
1 087 249 |
1 107,2 |
| Arlon |
LX AR |
Luxembourg |
Arlon |
317 |
65 565 |
206,8 |
| Ath |
HT AT |
Hainaut |
Ath |
668 |
130 448 |
195,3 |
| Bastogne |
LX BS |
Luxembourg |
Bastogne |
1 043 |
50 851 |
48,8 |
| Brugge |
WV BG |
West Flanders |
Brugge |
661 |
286 616 |
433,6 |
| Brussel |
BU BR |
Brussel |
Brussel |
162 |
1 249 597 |
7 713,6 |
| Charleroi |
HT CR |
Hainaut |
Charleroi |
472 |
399 742 |
846,9 |
| Dendermonde |
OV DM |
East Flanders |
Dendermonde |
342 |
207 562 |
606,9 |
| Diksmuide |
WV DK |
West Flanders |
Diksmuide |
362 |
52 550 |
145,2 |
| Dinant |
NA DN |
Namur |
Dinant |
1 592 |
113 173 |
71,1 |
| Eeklo |
OV EK |
East Flanders |
Eeklo |
334 |
89 175 |
267,0 |
| Gent |
OV GT |
East Flanders |
Gent |
906 |
578 015 |
638,0 |
| Halle-Vilvoorde |
VB HV |
Flemish Brabant |
Halle-Vilvoorde |
949 |
669 330 |
705,3 |
| Hasselt |
LI HS |
Limburg |
Hasselt |
915 |
431 328 |
471,4 |
| Huy |
LG HY |
Liège |
Huy |
659 |
115 830 |
175,8 |
| Ieper |
WV IP |
West Flanders |
Ieper |
550 |
108 129 |
196,6 |
| Kortrijk |
WV KR |
West Flanders |
Kortrijk |
403 |
302 332 |
750,2 |
| La Louvière |
HT MC |
Hainaut |
Mouscron |
218 |
142 019 |
651,5 |
| Leuven |
VB LV |
Flemish Brabant |
Leuven |
1 169 |
527 443 |
451,2 |
| Liège |
LG LG |
Liège |
Liège |
797 |
628 381 |
788,4 |
| Maaseik |
LI MS |
Limburg |
Maaseik |
909 |
258 469 |
284,3 |
| Marche-en-Famenne |
LX MR |
Luxembourg |
Marche-en-Famenne |
954 |
57 667 |
60,4 |
| Mechelen |
AN MH |
Antwerpen |
Mechelen |
510 |
359 299 |
704,5 |
| Mons |
HT MN |
Hainaut |
Mons |
584 |
260 855 |
446,7 |
| Namur |
NA NM |
Namur |
Namur |
1 165 |
323 859 |
278,0 |
| Neufchâteau |
LX NC |
Luxembourg |
Neufchâteau |
1 355 |
65 901 |
48,6 |
| Nivelles |
BW NV |
Walloon Brabant |
Nivelles |
1 097 |
414 130 |
377,5 |
| Oostende |
WV OS |
West Flanders |
Oostende |
292 |
160 032 |
548,1 |
| Oudenaarde |
OV OD |
East Flanders |
Oudenaarde |
419 |
128 081 |
305,7 |
| Philippeville |
NA PV |
Namur |
Philippeville |
909 |
66 863 |
73,6 |
| Roeselare |
WV RS |
West Flanders |
Roeselare |
272 |
159 509 |
586,4 |
| Sint-Niklaas |
OV SN |
East Flanders |
Sint-Niklaas |
530 |
264 331 |
498,7 |
| Soignies |
HT SG |
Hainaut |
Soignies |
355 |
108 487 |
305,6 |
| Thuin |
HT TN |
Hainaut |
Thuin |
780 |
92 684 |
118,8 |
| Tielt |
WV TL |
West Flanders |
Tielt |
330 |
95 620 |
289,8 |
| Tongeren |
LI TG |
Limburg |
Tongeren |
598 |
210 301 |
351,7 |
| Tournai - Mouscron |
HT TR |
Hainaut |
Tournai |
709 |
225 839 |
318,5 |
| Turnhout |
AN TH |
Antwerpen |
Turnhout |
1 357 |
479 974 |
353,7 |
| Verviers |
LG VV |
Liège |
Verviers |
2 016 |
290 756 |
144,2 |
| Veurne |
WV VR |
West Flanders |
Veurne |
275 |
61 587 |
224,0 |
| Virton |
LX VT |
Luxembourg |
Virton |
771 |
55 162 |
71,5 |
| Waremme |
LG WR |
Liège |
Waremme |
390 |
84 071 |
215,6 |
Membership in international organisations and treaties
Expand list
Political Alliances
Regional Unions
Military alliances/Arms control
Law enforcement
Business Alliances
Fishery
Financial
Free Trade Area, Internal Market
Technical alliances
Environment
Transport
Cientific
Humanitarian Unions
Cultural Unions
 |
If you have suggestions to include other information or you find missed links, please inform us!
Click here ... |
International Border disputes
Expand list
|
Fast selection
List of international
organisations
and treaties
Existing
thematical maps
|
