| |
| Capital |
Currency | Government system |
|---|
| Washington, D.C. |
US-Dollar (USD) |
Presidential system |
| Official language | Region |
Population |
|---|
| English |
North America |
Estimation 2024 - 340 110 988 |
Country map - Administrative structure - Population density of United States of America
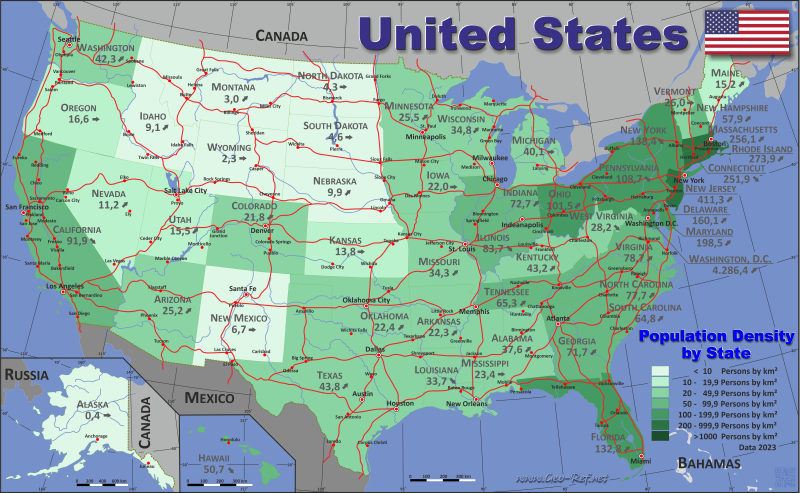
United States of America - Click on the map to get a enlarged image in PDF format!
Other language versions are easy to generate, the description is in an own layer
Conditions for thematic maps with your own data and logotype
Delivery as printable file by e-mail or plot by post office |
|---|
| Layer | |
| Province: | yes |
| Streets: | yes |
| Infrastructure: | no |
| Rivers: | yes |
|
| Size | bis A2 |
| Supply in | 7 working days |
| Price |
| 1 bis 3 | t
80 |
| > 3 | On request |
|
 |
All information published herein is free usable quoting the source,
including the maps, if they are not modified |
|---|
Statistical Data - Population density according to the administrative structure
The population data in the table below is an estimation for 2024, based on the census data from 2020.
Click on the column header brings the table in order of the column header. The default order is the State name.
| State |
ISO
3166-2 |
Capital |
Area
(km²) |
Population |
Density
(pers/km²) |
|---|
| Total |
|
|
9 832 800 |
340 110 988 |
34,6 |
|---|
| Last update: 12/06/2025 - 08:44:28 |
| Alabama |
US-AL |
Montgomery |
135 767 |
5 157 699 |
38,0 |
| Alaska |
US-AK |
Juneau |
1 723 337 |
740 133 |
0,4 |
| Arizona |
US-AZ |
Phoenix |
295 234 |
7 582 384 |
25,7 |
| Arkansas |
US-AR |
Little Rock |
137 732 |
3 088 354 |
22,4 |
| California |
US-CA |
Sacramento |
423 967 |
39 431 263 |
93,0 |
| Colorado |
US-CO |
Denver |
269 601 |
5 957 493 |
22,1 |
| Connecticut |
US-CT |
Hartford |
14 357 |
3 675 069 |
256,0 |
| Delaware |
US-DE |
Dover |
6 446 |
1 051 917 |
163,2 |
| District of Columbia |
US-DC |
Washington |
158,4 |
702 250 |
4 433,4 |
| Florida |
US-FL |
Tallahassee |
170 312 |
23 372 215 |
137,2 |
| Georgia |
US-GA |
Atlanta |
153 910 |
11 180 878 |
72,6 |
| Hawaii |
US-HI |
Honolulu |
28 313 |
1 446 146 |
51,1 |
| Idaho |
US-ID |
Boise |
216 643 |
2 001 619 |
9,2 |
| Illinois |
US-IL |
Springfield |
149 995 |
12 710 158 |
84,7 |
| Indiana |
US-IN |
Indianapolis |
94 326 |
6 924 275 |
73,4 |
| Iowa |
US-IA |
Des Moines |
145 746 |
3 241 488 |
22,2 |
| Kansas |
US-KS |
Topeka |
213 100 |
2 970 606 |
13,9 |
| Kentucky |
US-KY |
Frankfort |
104 656 |
4 588 372 |
43,8 |
| Louisiana |
US-LA |
Baton Rouge |
135 659 |
4 597 740 |
33,9 |
| Maine |
US-ME |
Augusta |
91 633 |
1 405 012 |
15,3 |
| Maryland |
US-MD |
Annapolis |
31 131 |
6 263 220 |
201,2 |
| Massachusetts |
US-MA |
Boston |
27 336 |
7 136 171 |
261,1 |
| Michigan |
US-MI |
Lansing |
250 487 |
10 140 459 |
40,5 |
| Minnesota |
US-MN |
St Paul |
225 163 |
5 793 151 |
25,7 |
| Mississippi |
US-MS |
Jackson |
125 438 |
2 943 045 |
23,5 |
| Missouri |
US-MO |
Jefferson City |
180 540 |
6 245 466 |
34,6 |
| Montana |
US-MT |
Helena |
380 831 |
1 137 233 |
3,0 |
| Nebraska |
US-NE |
Lincoln |
200 330 |
2 005 465 |
10,0 |
| Nevada |
US-NV |
Carson City |
286 380 |
3 267 467 |
11,4 |
| New Hampshire |
US-NH |
Concord |
24 214 |
1 409 032 |
58,2 |
| New Jersey |
US-NJ |
Trenton |
22 591 |
9 500 851 |
420,6 |
| New Mexico |
US-NM |
Santa Fe |
314 917 |
2 130 256 |
6,8 |
| New York |
US-NY |
Albany |
141 397 |
19 867 248 |
140,5 |
| North Carolina |
US-NC |
Raleigh |
139 391 |
11 046 024 |
79,2 |
| North Dakota |
US-ND |
Bismarck |
183 108 |
796 568 |
4,4 |
| Ohio |
US-OH |
Columbus |
116 098 |
11 883 304 |
102,4 |
| Oklahoma |
US-OK |
Oklahoma City |
181 037 |
4 095 393 |
22,6 |
| Oregon |
US-OR |
Salem |
254 799 |
4 272 371 |
16,8 |
| Pennsylvania |
US-PA |
Harrisburg |
119 280 |
13 078 751 |
109,6 |
| Rhode Island |
US-RI |
Providence |
4 001 |
1 112 308 |
278,0 |
| South Carolina |
US-SC |
Columbia |
82 933 |
5 478 831 |
66,1 |
| South Dakota |
US-SD |
Pierre |
199 729 |
924 669 |
4,6 |
| Tennessee |
US-TN |
Nashville |
109 153 |
7 227 750 |
66,2 |
| Texas |
US-TX |
Austin |
695 662 |
31 290 831 |
45,0 |
| Utah |
US-UT |
Salt Lake City |
219 882 |
3 503 613 |
15,9 |
| Vermont |
US-VT |
Montpelier |
24 906 |
648 493 |
26,0 |
| Virginia |
US-VA |
Richmond |
110 787 |
8 811 195 |
79,5 |
| Washington |
US-WA |
Olympia |
184 661 |
7 958 180 |
43,1 |
| West Virginia |
US-WV |
Charleston |
62 756 |
1 769 979 |
28,2 |
| Wisconsin |
US-WI |
Madison |
169 635 |
5 960 975 |
35,1 |
| Wyoming |
US-WY |
Cheyenne |
253 335 |
587 618 |
2,3 |
The following table lists the United States managed, claimed, or occupied overseas territories. The data is from 2019.
| Status |
ISO
3166-2 |
Status |
Capital |
Area
(km²) |
Population |
Density
(pers/km²) |
|---|
| Total |
|
|
|
23 945 |
3 653 530 |
152,6 |
|---|
| Last update: 12/06/2025 - 08:44:28 |
| American Samoa |
ASM |
Unincorporated |
Pago Pago |
1 505 |
55 312 |
36,8 |
| Baker Island |
|
Unincorporated |
- |
2 |
0 |
0,0 |
| Guam |
GUM |
Unincorporated |
Hagatna |
1 478 |
168 775 |
114,2 |
| Guantanamo |
|
Occupied |
|
118 |
8 500 |
72,0 |
| Howland Island |
|
Unincorporated |
- |
2 |
0 |
0,0 |
| Jarvis Island |
|
Unincorporated |
- |
6 |
0 |
0,0 |
| Johnston Atoll |
|
Unincorporated |
- |
3 |
0 |
0,0 |
| Kingman Reef |
|
Unincorporated |
- |
0 |
0 |
0,0 |
| Midway Atoll |
|
Unincorporated |
- |
8 |
0 |
0,0 |
| Navassa Island |
|
Unincorporated |
- |
8 |
0 |
0,0 |
| Northern Mariana Islands |
MNP |
Unincorporated |
Saipan |
5 117 |
47 923 |
9,4 |
| Palmyra Atoll |
|
Incorporated |
- |
4 |
0 |
0,0 |
| Puerto Rico |
PRI |
Unincorporated |
San Juan |
13 791 |
3 285 874 |
238,3 |
| U S Virgin Islands |
VIR |
Unincorporated |
Charlotte Amalie |
1 898 |
87 146 |
45,9 |
| Wake Island |
|
Unincorporated |
- |
7 |
0 |
0,0 |
Membership in international organisations and treaties
Expand list
Political Alliances
Regional Unions
Military alliances/Arms control
Law enforcement
Business Alliances
Fishery
Financial
Free Trade Area, Internal Market
Technical alliances
Environment
Transport
Cientific
Humanitarian Unions
Cultural Unions
 |
If you have suggestions to include other information or you find missed links, please inform us!
Click here ... |
International Border disputes
Expand list
Land boundaries
Maritime boundaries
|
Fast selection
List of international
organisations
and treaties
Existing
thematical maps
|
