Republic of China (Taiwan)
| Capital |
Currency | Government system |
|---|
| Taipei |
New Taiwan Dollar (TWD) |
Semi-presidential system |
| Official language | Region |
Population |
|---|
| Standard Chinese |
Far East |
Census 2020
23 829 897 |
Country map - Administrative structure - Population density of Taiwan
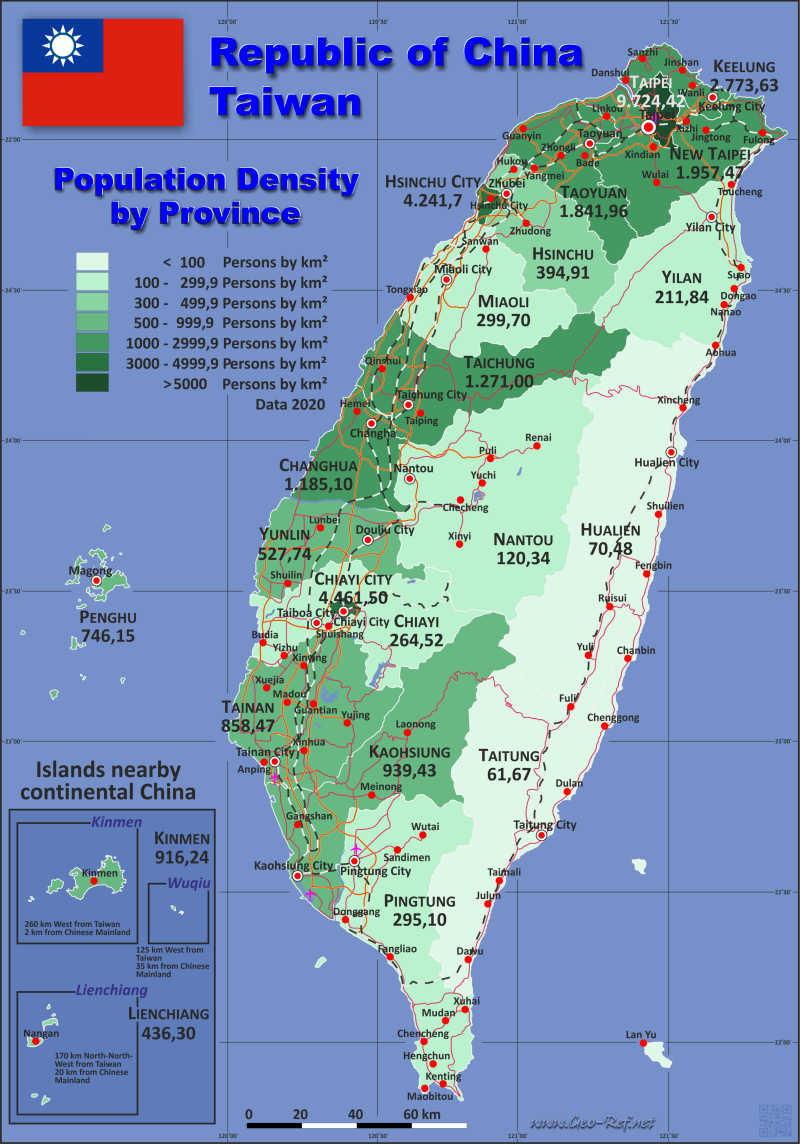
Taiwan map - Click the map to get map as PDF file.
Other language versions are easy to generate, the descriptions are in own layers
Conditions for thematic maps with your own data and logotype
Delivery as printable file by e-mail or plot by post office
|
|---|
| Layers | |
| Provinces: | yes |
| Streets: | yes |
| Infrastructure: | yes |
| Rivers: | yes |
|
| Size | Till A2 |
| Delivery time | 7 working days | | Price |
| 1 bis 3 | 70 € | | > 3 | On request |
|
 |
All information published herein is free usable quoting the source,
including the maps, if they are not modified
|
|---|
Statistical data - Population density according to the administrative structure
The population data of the table below is census data from 2020, last available data.
Click on the column header brings the table in order of the column header.
The default order is the province name.
| Province |
ISO
3166-2 |
Type |
Capital |
Area
(km²) |
Population |
Density
(pers/km²) |
| Total |
|
|
|
36 210 |
23 829 897 |
658,10 |
|---|
| Last update: 17.01.2023 - 22:59:26 |
|---|
| Changhua |
TW-CHA |
District |
Changhua |
1 074 |
1 186 795 |
1 105,02 |
| Chiayi |
TW-CYQ |
Municipality |
Chiayi city |
1 902 |
464 164 |
244,04 |
| Chiayi City |
TW-CYI |
District |
Chiayi city |
60 |
252 028 |
4 200,47 |
| Hsinchu |
TW-HSQ |
District |
Zhubei |
1 428 |
633 163 |
443,39 |
| Hsinchu City |
TW-HSZ |
Municipality |
Hsinchu City |
104 |
499 468 |
4 802,58 |
| Hualien |
TW-HUA |
District |
Hualien |
4 629 |
300 406 |
64,90 |
| Kaohsiung |
TW-KHH |
Special municipality |
Kaohsiung |
2 952 |
2 734 275 |
926,24 |
| Keelung |
TW-KEE |
Municipality |
Keelung |
133 |
367 264 |
2 761,38 |
| Kinmen |
TW-KIN |
District |
Kinmen |
153 |
67 173 |
439,04 |
| Lienchiang |
TW-LIE |
District |
Nangan |
30 |
11 813 |
393,77 |
| Miaoli |
TW-MIA |
District |
Miaoli |
1 820 |
521 962 |
286,79 |
| Nantou |
TW-NAN |
District |
Nantou |
4 106 |
430 211 |
104,78 |
| New Taipei |
TW-NWT |
Special municipality |
Taipei |
2 053 |
4 365 947 |
2 126,62 |
| Penghu |
TW-PEN |
District |
Magong City |
141 |
81 738 |
579,70 |
| Pingtung |
TW-PIF |
District |
Pingtung |
2 776 |
755 047 |
271,99 |
| Taichung |
TW-TXG |
Special municipality |
Taichung |
2 215 |
3 033 840 |
1 369,68 |
| Tainan |
TW-TNN |
Special municipality |
Tainan |
2 191 |
1 875 076 |
855,81 |
| Taipei |
TW-TPE |
Special municipality |
Taipei |
272 |
2 594 581 |
9 538,90 |
| Taitung |
TW-TTT |
District |
Taitung |
3 515 |
189 452 |
53,90 |
| Taoyuan |
TW-TAO |
Special municipality |
Taoyuan |
1 221 |
2 441 064 |
1 999,23 |
| Yilan |
TW-ILA |
District |
Yilan |
2 144 |
433 319 |
202,11 |
| Yunlin |
TW-YUN |
District |
Douliu City |
1 291 |
591 111 |
457,87 |
Existing thematic maps
|
External links change quickly - If you get a link error - Please inform us!
 |
Membership in international organisations and treaties
Expand list
Political Alliances
Regional Unions
Law enforcement
Fishery
Financial
Free Trade Area, Internal Market
Technical alliances
Transport
Cultural Unions
|
|
If you have suggestions to include other information or you find missed links, please inform us!
Click here ... |
See also neighboring states
|