Commonwealth of Australia
| Capital |
Currency | Government system |
|---|
| Canberra |
Australian Dollar (AUD) |
Parliamentary democracy |
| Official language | Region |
Population |
|---|
| English |
Australia & Oceania |
Estimation 2024
27 194 673 |
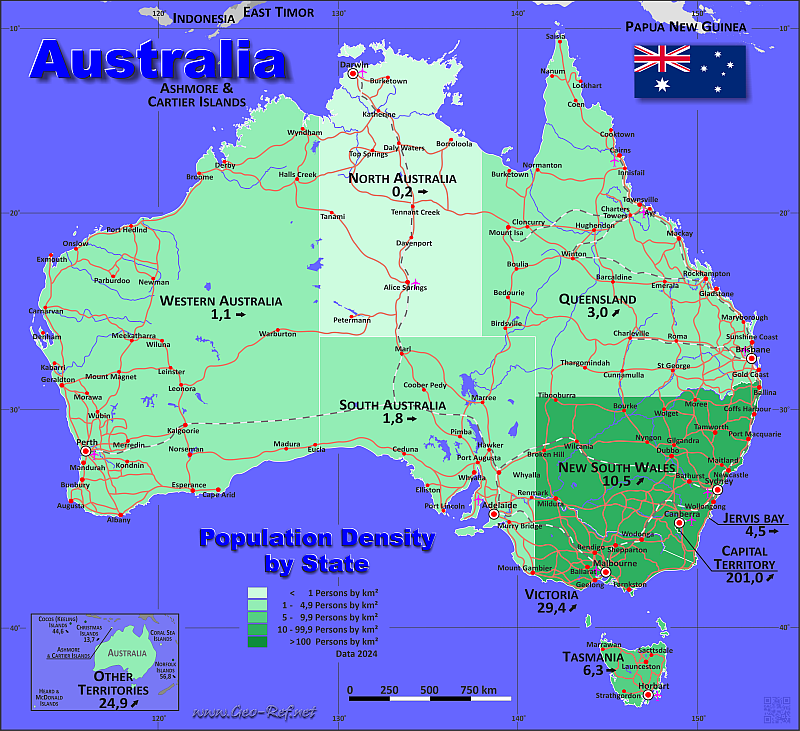
Country map - Administrative structure - Population density of Australia
Australia map - Click the map to get map as PDF file.
Other language versions are easy to generate, the descriptions are in own layers
Conditions for thematic maps with your own data and logotype
Delivery as printable file by e-mail or plot by post office
|
|---|
| Layers | |
| Provinces: | yes |
| Streets: | yes |
| Infrastructure: | yes |
| Rivers: | yes |
|
| Size | Till A2 |
| Delivery time | 7 working days | | Price |
| 1 bis 3 | 65 € | | > 3 | On request |
|
 |
All information published herein is free usable quoting the source,
including the maps, if they are not modified
|
|---|
Statistical data - Population density according to the administrative structure
The population data of the table below is an estimation form 2024, based on the census 2021.
Click on the column header brings the table in order of the column header.
The default order is the state name.
| State |
ISO
3166-2 |
Type |
Capital |
Area
(km²) |
Population |
Density
(pers/km²) |
| Total |
|
|
|
7 687 477 |
27 194 673 |
3,5 |
|---|
| Last update: 19.06.2025 - 14:06:57 |
|---|
| Capital Territory |
AU-ACT |
Territory |
Canberra |
2 358 |
473 855 |
201,0 |
| Jervis Bay |
AU-JB |
Territory |
- |
67 |
304 |
4,5 |
| New South Wales |
AU-NSW |
State |
Sydney |
800 150 |
8 479 314 |
10,6 |
| Northern Australia |
AU-NT |
Territory |
Darwin |
1 347 791 |
255 069 |
0,2 |
| Other territories |
- |
Territory |
- |
218 |
4 994 |
22,9 |
| Queensland |
AU-QLD |
State |
Brisbane |
1 729 742 |
5 583 833 |
3,2 |
| South Australia |
AU-SA |
State |
Adelaide |
984 321 |
1 878 011 |
1,9 |
| Tasmania |
AU-TAS |
State |
Hobart |
68 401 |
575 496 |
8,4 |
| Victoria |
AU-VIC |
State |
Melbourne |
227 416 |
6 978 719 |
30,7 |
| Western Australia |
AU-WA |
State |
Perth |
2 527 013 |
2 965 078 |
1,2 |
The following table illustrate the external territories of Australia.
| External Territory |
ISO
3166-2 |
Capital
| Area
(km²) |
Population |
Density
(pers/km²) |
| Total |
|
|
6 677 212 |
5 690 |
0,0 |
|---|
| Last update: 19.06.2025 - 14:06:57 |
|---|
| Ashmore and Cartier Islands |
|
|
155 |
0 |
0 |
| Australian Antarctic Territory |
AU-AQ |
Davis Station |
5 896 500 |
1 000 |
<0,01 |
| Christmas Island |
AU-CX |
Flying Fish Cove |
136 |
1 865 |
13,7 |
| Cocos (Keeling) Islands |
AU-CC |
West Island |
14 |
625 |
44,6 |
| Coral Sea Islands |
|
Willis Island |
780 000 |
0 |
0,0 |
| Heard Island & McDonald Islands |
AU-HM |
Atlas Cove |
368 |
0 |
0,0 |
| Norfolk Island |
AU-NF |
Kingston |
39 |
2 200 |
56,8 |
Existing thematic maps
|
External links change quickly - If you get a link error - Please inform us!
 |
Membership in international organisations and treaties
Expand list
Political Alliances
Regional Unions
Military alliances/Arms control
Law enforcement
Business Alliances
Fishery
Financial
Free Trade Area, Internal Market
Technical alliances
Environment
Transport
Cientific
Humanitarian Unions
Cultural Unions
|
|
If you have suggestions to include other information or you find missed links, please inform us!
Click here ... |
International Border disputes
Expand list
See also neighboring states
|
| |