Republic of the Gambia
| Capital |
Currency | Government system |
|---|
| Banjul |
Dalasi (GMD) |
Presidential system |
| Official language | Region |
Population |
|---|
| English |
Africa |
Census 2024
2 422 712 |
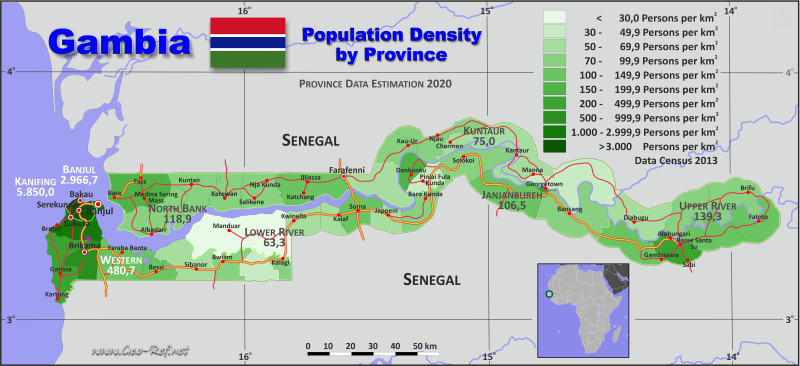
Country map - Administrative structure - Population density of Gambia
Gambia map - Click the map to get map as PDF file.
Other language versions are easy to generate, the descriptions are in own layers
Conditions for thematic maps with your own data and logotype
Delivery as printable file by e-mail or plot by post office
|
|---|
| Layers | |
| Provinces: | yes |
| Streets: | yes |
| Infrastructure: | yes |
| Rivers: | yes |
|
| Size | Till A2 |
| Delivery time | 7 working days | | Price |
| 1 bis 3 | 65 € | | > 3 | On request |
|
 |
All information published herein is free usable quoting the source,
including the maps, if they are not modified
|
|---|
Statistical data - Population density according to the administrative structure
The population data of the table below is census data from 2024, last available data.
Click on the column header brings the table in order of the column header.
The default order is the division name.
| Division |
ISO
3166-2 |
Capital |
Area
(km²) |
Population |
Density
(pers/km²) |
| Total |
|
|
10 499,4 |
2 422 712 |
212,3 |
|---|
| Last update: 11/04/202 - 00:44:02 |
|---|
| Banjul |
GM-BCC |
Banjul |
12,0 |
26 461 |
2 205,1 |
| Janjanbureh |
GM-CRR |
Janjanbureh |
1 385,5 |
147 412 |
106,4 |
| Kanifeng |
GM-KMC |
Kanifing |
76,0 |
379 348 |
4 991,4 |
| Kuntaur |
n.D. |
Kuntaur |
1 530,3 |
118 104 |
77,2 |
| Lower River |
GM-LRR |
Mansa Konko |
1 505,1 |
90 624 |
60,2 |
| North Bank |
GM-NBR |
Farafenni |
2 199,3 |
248 475 |
113,0 |
| Upper River |
GM-URR |
Basse Santa Su |
2 028,6 |
261 160 |
128,7 |
| Western |
GM-WCR |
Brikama |
1 762,6 |
1 151 128 |
653,1 |
The provinces are divided into districts, the data of which are shown in the table below The district data is from the census 2013, the province data is estimated for 2020.
| District |
Own |
Province |
Capital
| Area
(km²) |
Population |
Density
(pers/km²) |
| Total |
|
|
|
10 499,4 |
1 857 181 |
176,9 |
|---|
| Last update: 11/04/202 - 00:44:02 |
|---|
| Banjul |
BCC-1 |
Banjul |
Banjul |
12,0 |
31 054 |
2 587,8 |
| Basse Fulladu East |
URR-1 |
Upper River |
Basse Santa |
183,2 |
49 102 |
268,0 |
| Central Badibu |
NBR-1 |
North Bank |
Salikene |
255,5 |
19 491 |
76,3 |
| Foni Bintang-Karanai |
WCR-1 |
Western |
Sibanor |
296,0 |
17 119 |
57,8 |
| Foni Bondali |
WCR-2 |
Western |
Bondali |
173,3 |
7 578 |
43,7 |
| Foni Brefet |
WCR-3 |
Western |
Bessi |
128,9 |
14 523 |
112,7 |
| Foni Jarrol |
WCR-4 |
Western |
Kalagi |
78,3 |
6 883 |
87,9 |
| Foni Kansala |
WCR-5 |
Western |
Bwiam |
148,0 |
14 125 |
95,4 |
| Illiasa |
NBR-2 |
North Bank |
Illiassa |
356,5 |
48 620 |
136,4 |
| Janjanbureh |
CRR-1 |
Janjanbureh |
Janjanbureh |
12,4 |
3 789 |
305,6 |
| Jarra Central |
LRR-1 |
Lower River |
Jappeni |
132,7 |
8 342 |
62,9 |
| Jarra East |
LRR-2 |
Lower River |
Baro Kunda |
197,9 |
16 034 |
81,0 |
| Jarra West |
LRR-3 |
Lower River |
Soma |
190,0 |
26 214 |
138,0 |
| Jimara |
URR-2 |
Upper River |
Gambissara |
298,7 |
43 461 |
145,5 |
| Jokadu |
NBR-3 |
North Bank |
Kuntair |
277,1 |
22 312 |
80,5 |
| Kanifeng |
KMC-1 |
Kanifeng |
Kanifeng |
76,0 |
377 134 |
4 962,3 |
| Kantora |
URR-3 |
Upper River |
Garowol |
288,4 |
38 354 |
133,0 |
| Kiang Central |
LRR-4 |
Lower River |
Kwinella |
162,4 |
8 661 |
53,3 |
| Kiang East |
LRR-5 |
Lower River |
Kaiaf |
113,1 |
6 801 |
60,1 |
| Kiang West |
LRR-6 |
Lower River |
Manduar |
709,0 |
14 990 |
21,1 |
| Kombo Central |
WCR-6 |
Western |
Brikama |
171,2 |
140 029 |
817,9 |
| Kombo East |
WCR-7 |
Western |
Faraba Banta |
290,9 |
42 330 |
145,5 |
| Kombo North |
WCR-8 |
Western |
Sukuta |
183,7 |
339 377 |
1 847,5 |
| Kombo South |
WCR-9 |
Western |
Garissa |
292,3 |
106 780 |
365,3 |
| Lower Badibu |
NBR-4 |
North Bank |
Kerewan |
198,5 |
17 961 |
90,5 |
| Lower Fuladu West |
CRR-2 |
Janjanbureh |
Bansang |
370,4 |
39 804 |
107,5 |
| Lower Niumi |
NBR-5 |
North Bank |
Bara |
377,7 |
57 088 |
151,1 |
| Lower Saloum |
KU-1 |
Kuntaur |
Kau-Ur |
160,8 |
15 446 |
96,1 |
| Niamina Dankunku |
CRR-3 |
Janjanbureh |
Dankunku |
39,5 |
6 083 |
154,0 |
| Niamina East |
CRR-4 |
Janjanbureh |
Solokoi |
346,0 |
24 340 |
70,3 |
| Niamina West |
CRR-5 |
Janjanbureh |
Piniai Fula Kunda |
147,5 |
7 141 |
48,4 |
| Niani |
KU-2 |
Kuntaur |
Kantaur |
445,7 |
28 343 |
63,6 |
| Nianija |
KU-3 |
Kuntaur |
Charmen |
153,5 |
9 876 |
64,3 |
| Sabach Sanjal |
NBR-6 |
North Bank |
Farafenni |
343,9 |
23 728 |
69,0 |
| Sami |
KU-4 |
Kuntaur |
Georgetown |
512,0 |
24 365 |
47,6 |
| Sandu |
URR-4 |
Upper River |
Diabugu |
340,5 |
23 659 |
69,5 |
| Tumana |
URR-5 |
Upper River |
Kundam |
300,2 |
37 206 |
123,9 |
| Upper Fuladu West |
CRR-6 |
Janjanbureh |
Bansang |
469,7 |
44 047 |
93,8 |
| Upper Niumi |
NBR-7 |
North Bank |
Albadarr |
390,1 |
30 880 |
79,2 |
| Upper Saloum |
KU-5 |
Kuntaur |
Njau |
258,3 |
18 673 |
72,3 |
| Wuli East |
URR-6 |
Upper River |
Brifu |
335,7 |
23 612 |
70,3 |
| Wuli West |
URR-7 |
Upper River |
Kolibantang |
281,9 |
21 826 |
77,4 |
Existing thematic maps
|
External links change quickly - If you get a link error - Please inform us!
 |
Membership in international organisations and treaties
Expand list
Political Alliances
Regional Unions
Military alliances/Arms control
Law enforcement
Business Alliances
Fishery
Financial
Free Trade Area, Internal Market
Technical alliances
Transport
Cientific
Humanitarian Unions
Cultural Unions
|
|
If you have suggestions to include other information or you find missed links, please inform us!
Click here ... |
International Border disputes
Expand list
See also neighboring states
|
| |